Scientists' Explanation for Investigation 3
Natural and Anthropogenic Forcings
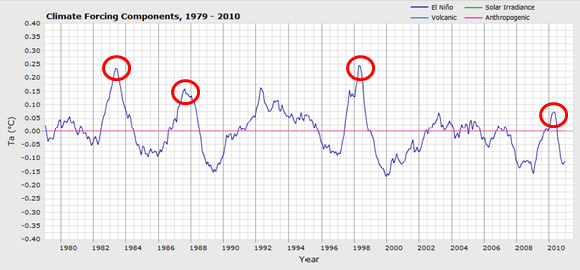
El Niño
An El Niño phase, a phase in the El Niño-Southern Oscillation (ENSO), can cause changes in global weather patterns by causing the water temperature off of South America to be warmer. El Niños occur every 3-7 years and typically last less than a year. In this graph, you can see the warmer temperature in 1982-83, 1986-88, 1997-98, and 2009-10 which coincide with strong El Niño events. You may notice two other periods which occur in the early 1990’s and early 2000’s where temperatures are warmer but these are considered weaker events as they occur over a longer time period rather than the typical El Niño event which lasts less than one year.
Volcanos
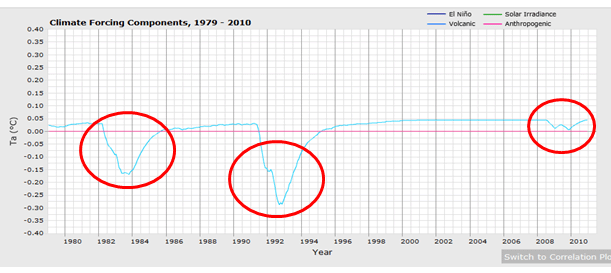
Volcanoes cause a cooling effect by emitting aerosols such as volcanic ash or dust, and sulfur dioxide that scatter incoming solar radiation. In this graph, you can see two major events that resulted in a decrease in temperature. The first one occurred in March 1982 when El Chichon, a volcano in Mexico erupted and the second began in June 1991 when Mount Pinatubo erupted. In the last decade, there were two smaller eruptions: Chaiten in May 2008 in Chile and Sarychev Peak in June 2009.
Solar Cycle
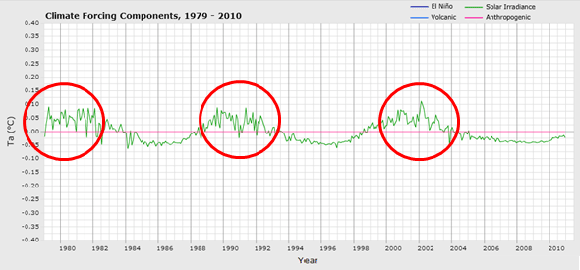
The amount of energy emitted by the sun is not constant. The periodic variation in the sun’s activity is called the solar cycle. During active periods, there is an increase in the amount of solar radiation emitted and an increase in the number of sunspots and solar flares. On the graph below, you can how these variations in solar forcing affect the temperature in the adjustable model. Small warmings occur at an 11 year interval (e.g.,1980, 1991, and 2002) and correspond to maxima in the 11-year solar cycle.
Natural vs. Anthropogenic
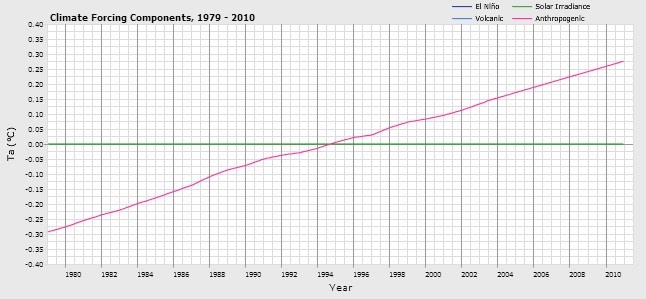
Of these three natural forcings, models show that El Nino phases have the greatest impact on temperature variation and that solar cycles produce only very small changes. However, in order to produce the warming trend we have seen over the past 30 years, anthropogenic forcings must be included in the model.
Our Human Fingerprint
How do scientists know that the increase in atmospheric CO2 is the result of human activity? First, the climate models, shown previously, compared the observed temperatures to those scientists expect when including different forcings––natural (El Niño cycles, volcanic eruptions, and solar cycles) and anthropogenic (human) activity. These models clearly showed that the recent rise in observed temperatures can only be explained when including human activity in the climate model.
In addition to climate models, there is another convincing line of evidence that has led scientists to the same conclusion. Different sources of carbon have their own “fingerprints.” These are often referred to as "fingerprints," because they help scientists identify the source of the carbon emissions. These carbon “fingerprints” are actually different carbon isotopes, or specifically the ratios of the carbon isotopes. Isotopes are atoms of the same element with a different number of neutrons in the nucleus and thus, different masses.
Carbon is composed of three carbon isotopes––14C, 13C, and 12C. The carbon isotope, 12C is the most common isotope with six protons and six neutrons and the carbon isotope most preferred by plants. The isotope, 13C, is heavier and commonly found in the gases emitted from volcanoes. A very small amount of carbon is in the form of the radioactive isotope, 14C, which is found in once-living matter up to the age of about 50,000 years.
Different ratios of the three carbon isotopes are found in plants, volcanic gases, and fossil fuels. These ratios help scientists determine the source of the carbon. The 13C/12C ratio of plants is less than that in the atmosphere because plants have a high amount of 12C. The 13C/12C ratio of volcanic gases is greater than that in atmosphere because volcanic gases have a high amount of 13C.
You learned that fossil fuels formed millions of years ago from ancient plants. Because fossil fuels formed millions of years ago, 14C is not emitted as fossil fuels are burned. As humans burn fossil fuels or forests, more of the 12Cis released into the atmosphere, which causes the ratio of 13C to 12C to decrease relative to the ratio in the atmosphere. Thus burning of fossil fuels will have a CO2 fingerprint with no 14C and a low 13C/12C ratio. Burning of wood will also have a low 13C/12C ratio, but with 14C.
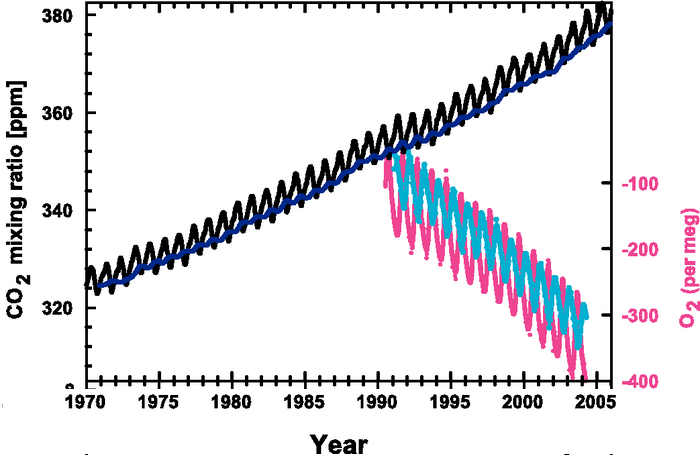
Scientists also have other convincing evidence––the concentration of atmospheric oxygen––that humans are causing the recent rise in atmospheric CO2. When fossil fuels are burned, carbon is released, and it bonds with oxygen to form CO2. Therefore, when fossil fuels are burned, CO2 increases and oxygen decreases. However, because the atmosphere has 500 times more oxygen than CO2, the decrease in the concentration of O2 due to the burning of fossil fuels are very small.
Richard Alley explains how we know that humans are causing the rise in atmospheric CO2 since the Industrial Revolution in the PBS video from Earth: The Operators' Manual.
Continued warming and an increased understanding of the U.S. temperature record, as well as multiple other sources of evidence, have strengthened our confidence in the conclusions that the warming trend is clear and primarily the result of human activities. - National Climate Assessment Report – Chapter 2


