The increase in Earth’s sea level is a truly tangible and visible consequence of changes in climate. How much sea level rise (SLR) might you expect to see in your own lifetime? What’s at stake for you based on your personal situation and characteristics?
Under the guidance of Florida Atlantic University’s (FAU) Center for Environmental Studies’ (CES) MaryBeth Hartman Kerber and Keren Bolter, this educational photo exhibit was created using local students as models. The group ranged in age from five to 22 years old and the locations chosen depict the cities in the U.S. that are most vulnerable to the effects of sea level rise.
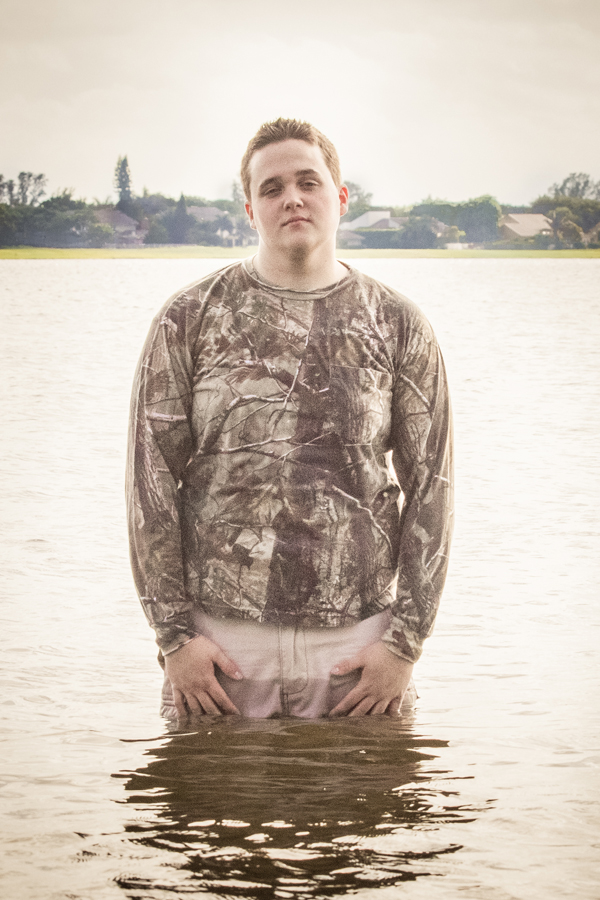
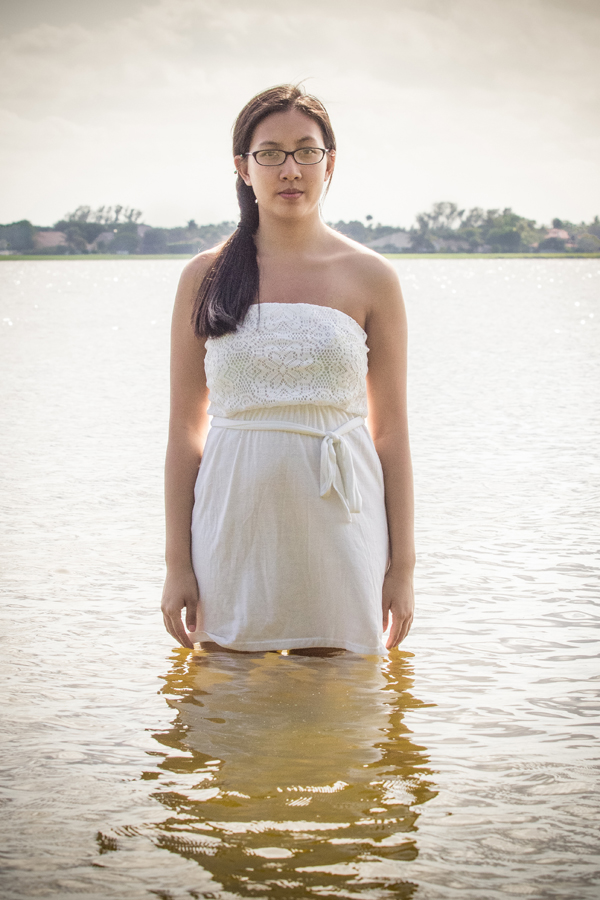
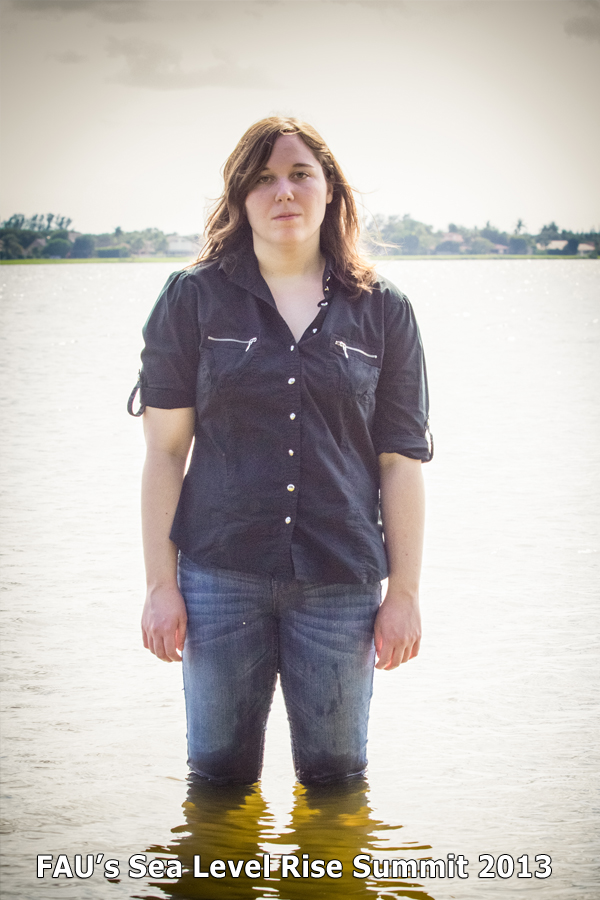
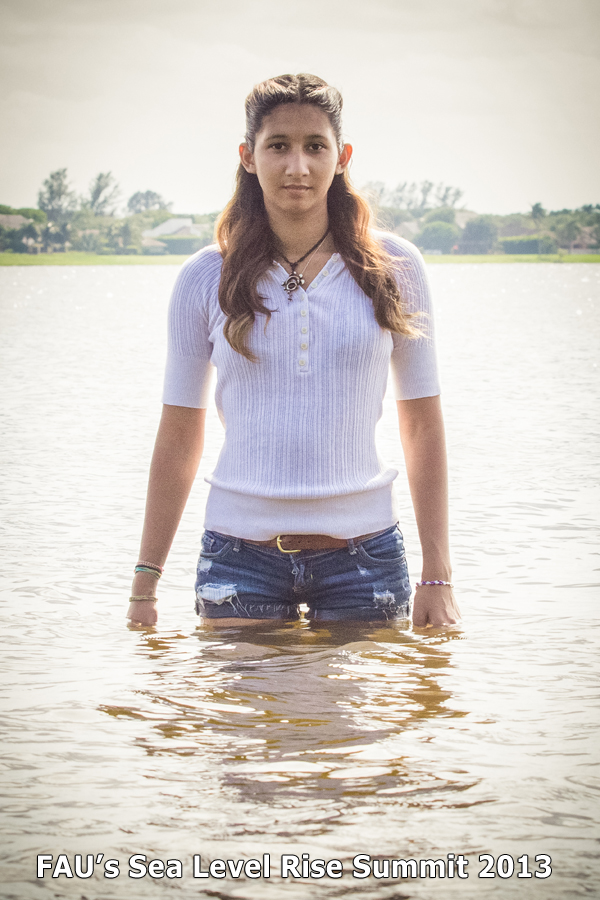
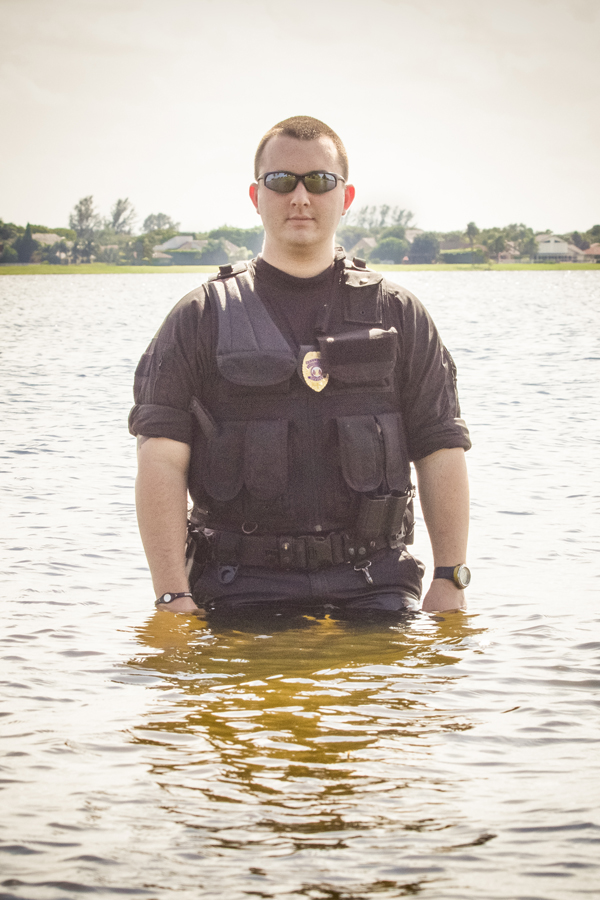
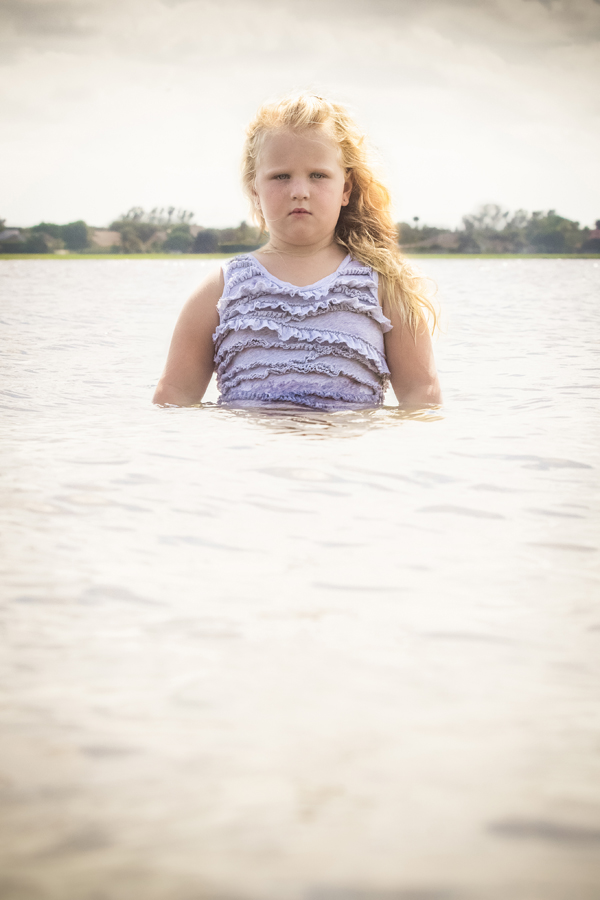
Before the photographs were taken, the students used sea level rise modeling equations and calculated the projections for their individual locations. The calculations took into consideration their age, gender and life expectancy. Using a permanent marker and yardstick, they marked the water level locations on their bodies and headed into the water. Please see below the photos for more information about these calculations.
CES worked with each student individually to position them properly and to match the water line to the sea level mark to create the common visual theme. Many longtime local residents were consulted before choosing the east side of Clear Lake, in West Palm Beach, as the possibility of alligator sightings were a major consideration.
This project was created as an educational exhibit for the CES’s Sea Level Rise Summits and has been subsequently viewed by thousands in a variety of public venues. It was gratifying to see how quickly the students went from the role of ‘model’ to active participant in their desire to understand and engage in the science behind the issues of sea level rise.
CES is currently seeking sponsors to enable other groups or organizations to replicate and expand upon this project.
|
|

|

|
||||||
| When Doug reaches his life expectancy (2064), sea level in Cape May, NJ will be 26 inches higher than today. |
When Nisa reaches her life expectancy (2064), sea level in Cape Cod, MA will be 23 inches higher than today. |
When Khoa reaches his life expectancy (2064), sea level in Boca Raton, FL will be 21 inches higher than today. |
When Taryn reaches her life expectancy (2063), sea level in Manhattan, NY will be 23 inches higher than today. |
||||||
|
|
|
|
||||||
| When Liz reaches her life expectancy (2062), sea level in Los Angeles, CA will be 12 inches higher than today. | When Lizette reaches her life expectancy (2067), sea level in Sarasota, FL will be 29 inches higher than today. |
When Jeremy reaches his life expectancy (2061), sea level in New Orleans, LA will be 32 inches higher than today.
|
When Lauren reaches her life expectancy (2078), sea level in Miami Beach, FL will be 36 inches higher than today. | ||||||

|

|

|

|
||||||
| When Ariel reaches her life expectancy (2068), sea level in Cape Canaveral, FL will be 29 inches higher than today. |
When Sarah reaches her life expectancy (2068), sea level in Portland, OR will be 26 inches higher than today.
|
When Roy reaches his life expectancy (2076), sea level in New Orleans, LA will be 39 inches higher than today. | When George reaches his life expectancy (2078), sea level in Richmond, VA will be 35 inches higher than today. |
These photos depict individuals for whom personal SLR projections have been calculated based on age, gender, and SLR projections:
♦"Low" corresponds with sharp reductions in carbon pollution, and some good luck
♦"Medium" corresponds with medium reductions in carbon pollution, and some medium luck
♦"High" corresponds with continuing our current path, and some bad luck
♦Luck means: does the effect of temperature on sea level turn out to be toward the low (good luck) or high (bad luck) end of what we expect.
For more information,
contact Mary Beth Hartman Kerber,
CES Research & Outreach Coordinator
Phone: (954) 236-1334
Email: mhartman@fau.edu