EXPLORATION 1C
Rate of Rise Since the Industrial Revolution
In order to measure sea level, both tide gauges and satellite altimetry are used. Tide gauges measure sea level relative to the ocean floor, and Earth’s center is used as the reference with satellite altimetry. The figure below, you observe a lot of variation from 1880 until the early 1990’s. You will also observe two different lines (current and old). This data is collected from tide gauges and it can be very difficult to derive precise data from these gauges. By the early 1990s, NASA began collecting satellite altimeter data, which is more reliable than tide gauges. However, even with the uncertainty of tide gauge data, the trend of rising sea levels is evident.
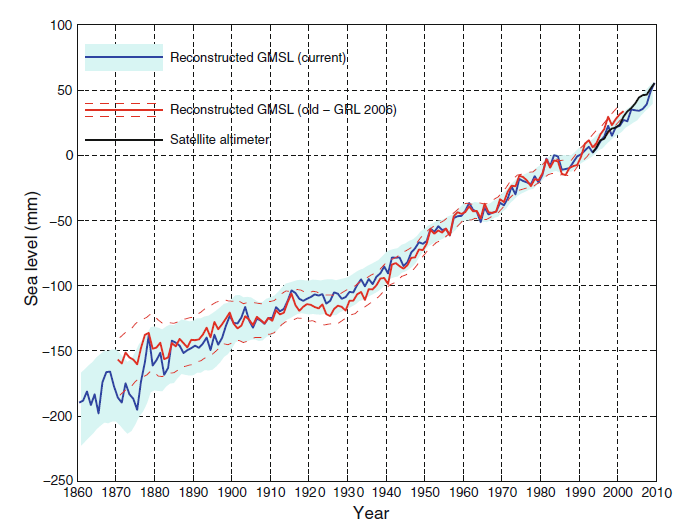
- What year does the graph indicate satellite altimetry was first used to measure sea level?
- Calculate the approximate rate of change for two time periods. Complete the table below by answering the following questions.
- What is the range of years for each time period listed?
- What is the approximate global mean sea level (mm) for each year at the beginning and end of the range?
- What is the approximate rate of sea level rise for each time period?
Subtract the global mean sea level of the most recent year from the oldest year and divide by the range to obtain the rate of change per year over the time period listed.
![]()
|
Time Period |
Range of Years |
Global Mean Sea Level (mm) |
Approximate Rate of Change |
|
1900 -2009 |
109 years |
|
|
|
|
|||
|
1961 -2009 |
49 years |
|
|
|
|
|||
|
1993 – 2009 |
16 years |
|
|
|
|