EXPLORATION 1
Sea Ice Extent
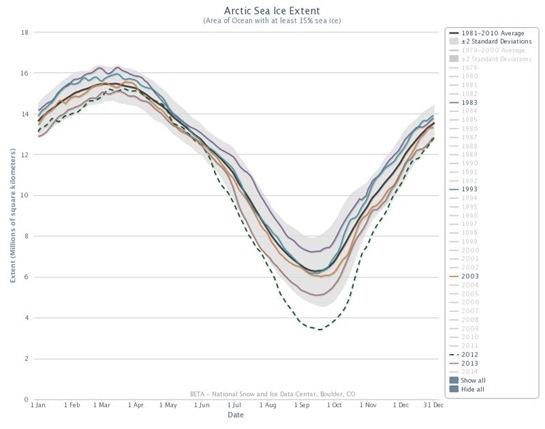
Use the NSIDC Interactive Sea Ice Graph to explore changes in the sea ice extent over the past few decades.
http://nsidc.org/arcticseaicenews/charctic-interactive-sea-ice-graph/
To answer the following questions, you will need to select the year in the legend on the right side of the graph and then hold your cursor over the line to obtain the data.
- Use the Interactive Sea Ice Graph to determine the highest (generally mid-March) and lowest (generally mid-September) sea ice extent in millions of km2 for the years listed in the table. Record the area to the nearest 0.1 million km2.
|
Area of Sea Ice (km2) |
||||
|
DATE |
1983 |
1993 |
2003 |
2013 |
|
Highest |
|
|
||
|
Lowest |
|
|||
- Follow the steps below to calculate the average percentage of end-of-winter sea ice extent decrease per decade in million km2 for the 1983-2013 March 14th dates.
- Calculate the overall change in sea ice extent from 1983 to 2013.
- Calculate the percentage of sea ice loss from 1983 to 2013.
- Calculate the average percentage loss per decade.
- Follow the steps below to calculate the average percentage of end-of-summer sea ice extent decrease per decade in million km2 for the 1983-2013 September 13th dates.
- Calculate the overall change in sea ice extent from 1983 to 2013.
- Calculate the percentage of sea ice loss from 1983 to 2013.
- Calculate the average percentage loss per decade.
- How does the rate of summer Arctic sea ice melt over the last decade compare to that of the previous decade?
- The IPCC states that there has been a downward trend of 3.8% per decade in the annu l average extent of sea ice in the Arctic from 1979-2012. Explain why you calculated a larger percentage loss above.
Note: If you’d like to keep your graph, you can download it by clicking on the Export to raster or vector image button.

- Click on 1981-2010 Average (top button) to compare highest and lowest sea ice extent.
- What was the highest and lowest average end-of-winter sea ice extent and corresponding year?
- What was the highest and lowest average end-of-summer sea ice extent and corresponding year?
Learn about why the NSIDC chose the average for 1981-2010.
