Exploration 2
The Rate of Sea Ice Melt Over the Past Few Decades
For this exploration you will analyze geospatial data for sea ice extent as well as anomaly trends of that data over time. The following two definitions will help you throughout this exploration.
- An anomaly is a departure from the long-term average. A positive anomaly means that the sea ice extent was greater than the long-term average, and a negative anomaly means that the sea ice extent was less than the long-term average. Anomalies are useful in analyzing trends.
- The slope of a line is a measurement of how steep the line is. The slope of a line is also known as the rate of change. It is calculated by the following equation: Slope = vertical change (rise)/horizontal change (run) = y2 - y1/ x2 – x1
Go to: http://nsidc.org/cgi-bin/bist/bist.pl?config=seaice_extent_trends
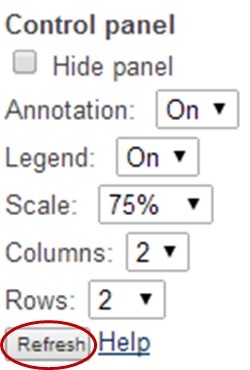
- In the first column, second row choose the month of March from the dropdown menu.
- In the first column, third row, choose the month of September from the dropdown menu.
- In the first column, first row, click on the refresh button.
- You should now see the Sea Ice Concentration Trends for the most recent March and September months in the second and third rows under the second column.
- You should also see a graph that shows the March and September Sea Ice Extent Anomalies for 1979 to the most current year in the second and third rows under the third column.
Using these data trends, answer the following questions.
- Compare the March and September Sea Ice Concentration Trends in the second column. What month and region appears to be experiencing the most melting?
- Focus on the March and September Sea Ice Extent Anomalies data shown in the third column.
- Compare and contrast the data for March 1979-2014 to the data for September 1979-2014.
- What is the slope or rate of change for the data for March 1979-2014?
- What is the slope or rate of change for the data for September 1979-2013?
- Explain why the lowest ice extent is in in late summer (September) rather than in early summer (June or July).
- Explain why there is less change over the 30 years in the ice extent for late winter/early spring data compared to late summer/early fall data?