Scientists' Explanation for Investigation 5
Drought and Wildfires
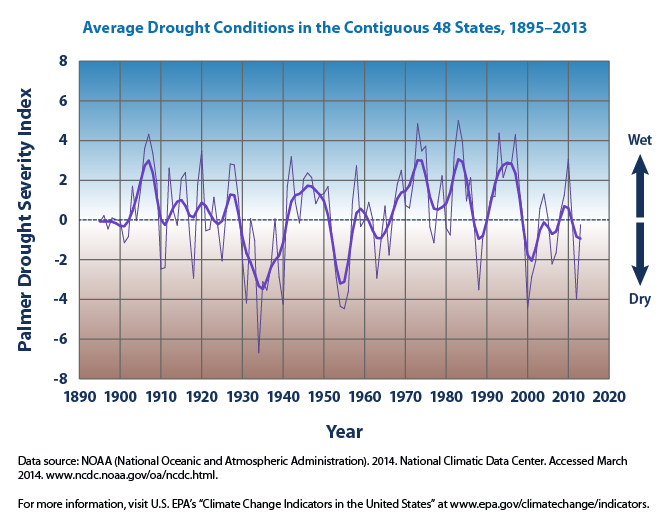
In this investigation you first analyzed animated maps of the Palmer Drought Severity Index (PDSI) and saw how drought conditions across the United States vary from place to place. The frequency and severity of drought in a specific region depends on global wind and ocean circulation, and regional patterns of temperature, precipitation, evaporation, soil moisture, and wind speed. When some areas of the U. S. were experiencing drought, other areas were experiencing wetter than normal conditions. Drought conditions may also fluctuate over time, which can be observed in this graph of the average drought conditions in the contiguous 48 states from 1895 through 2013. You previously learned about the Dust Bowl of 1933 and 34. This heat wave led to a severe drought, which can be seen as a large increase in dryness.
Image Source: NOAA, NCDC
The PDSI of July 1934 illustrates the peak of the Dust Bowl and the widespread nature of that particular drought.
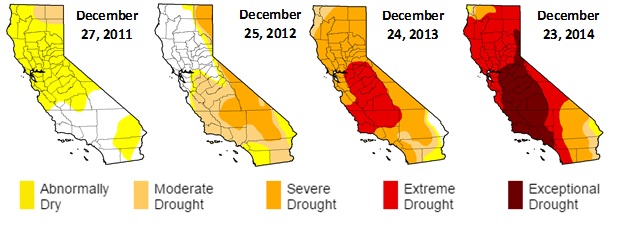
In early 2013, the state of California began experiencing a severe drought that is now considered one of the worst drought periods in more than 100 years. Scientists researching the causes of this drought think that the high pressure ridge sitting off the west coast of the U.S. diverted storms northward and away from California. The same study also suggests that this type of high pressure ridge played a role in the 1933-34 drought. Scientists are not sure what causes these high pressure ridges to develop but there is some evidence that they could be caused by changes in ocean temperatures, but most likely they are just part of natural variability.
This NASA video called California Drought explains some of the research being conducted by NASA scientists to determine what the underlying causes of this severe drought.
Future Drought Projections
Lower precipitation projections do not necessarily mean increased drought conditions. While associated with decreased precipitation, there are other factors that also contribute to drought, such as warmer temperatures or increased evaporation rates.
Droughts are complex events that can be associated with significantly reduced precipitation, dry soils that fail to sustain crops, and reduced levels in reservoirs and other bodies of water that imperil drinking supplies. The maps show projected wet and dry conditions for different regions.
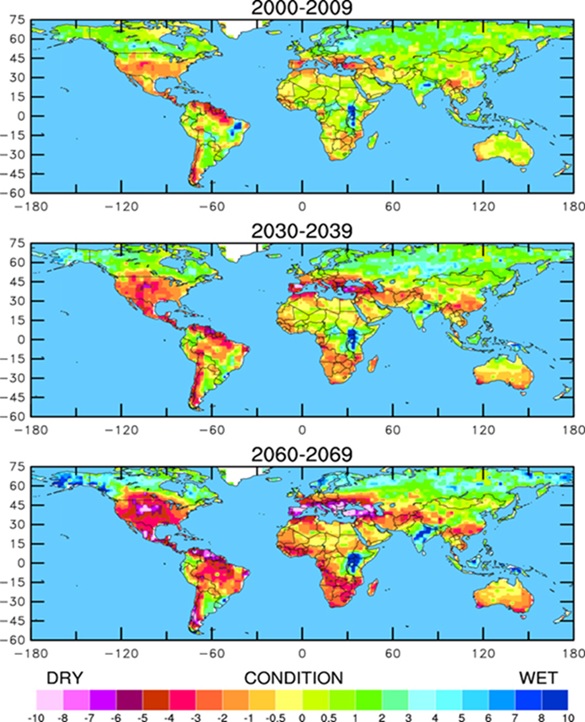 Image Source:
UCAR
Image Source:
UCAR
Wildfires
Wildfires play an important role in maintaining many ecosystems types. In fact, without wildfires, many ecosystems would change (succeed) to other ecosystem types. For example, when wildfires are suppressed, it allows areas to become overgrown with too many trees and shrubs. Wildfires benefit plants and animals by promoting diversity through the release of nutrients into the soil. This process allows more plants species to grow thus attracting a greater diversity of wildlife.
However, wildfires occurring too often or burning greater land area can negatively impact the plant and animals species that inhabit the area. In recent decades, scientists have been documenting an increase in the land area being burned by wildfire in many states.
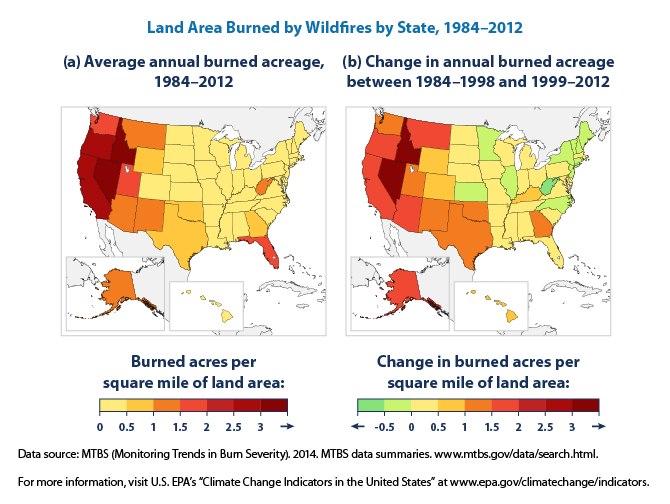 Image Source:
EPA
Image Source:
EPA