Scientists' Explanation for Exploration 1A
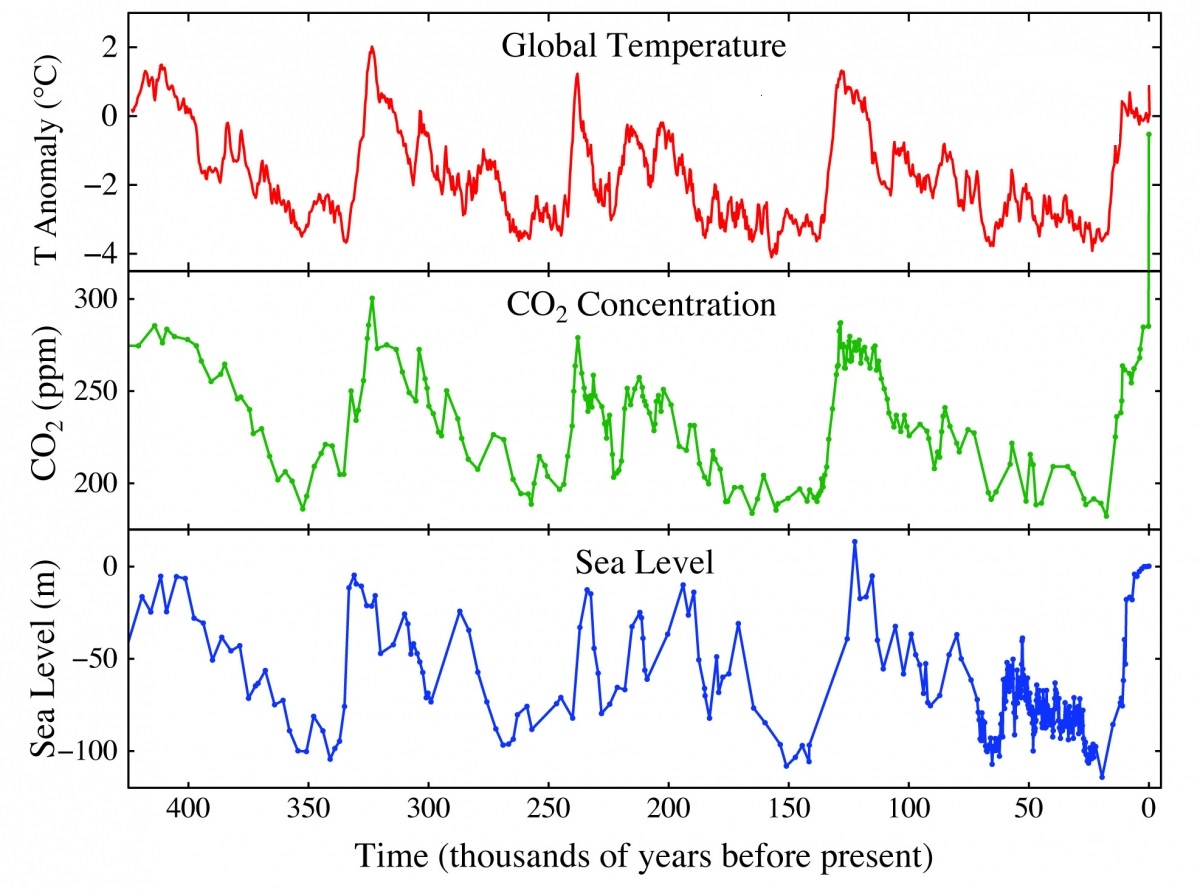
Sea Level Change Over 400,000 Years
The graph shows the global temperature anomalies (˚C), CO2 concentrations (ppm) and sea level (m) over the past 400,000 years. During the change from a glacial to an interglacial period, global temperatures increased approximately 6 to 8˚C and CO2 increases approximately 100ppm (from 180 to 280ppm). When Earth warms, the ice stored at the poles melts, raising sea levels. Therefore, sea levels have oscillated, going up and down about 90 meters (300 feet).

