Exploration 1
Projected Regional Temperature Change
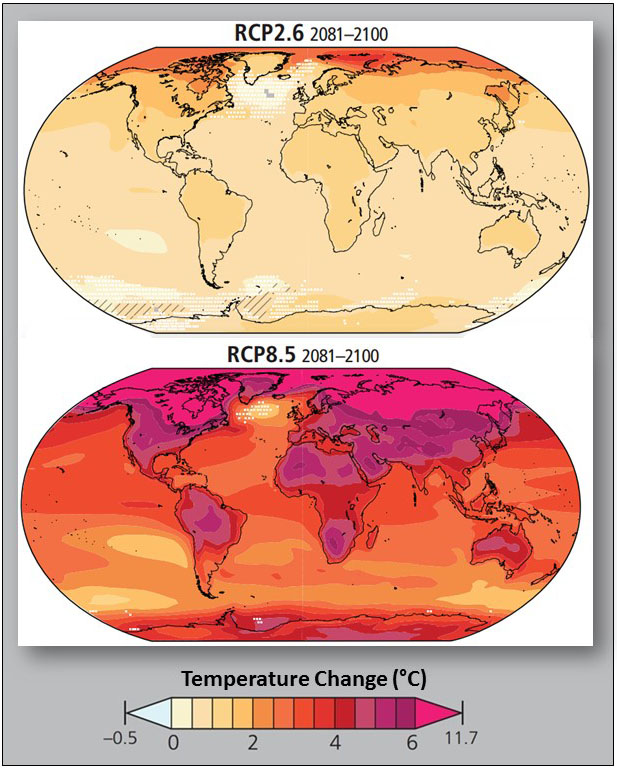
The figure shows projected change in the average annual temperature over the period 2081-2100 (compared to the period 1986-2005) under the low scenario (RCP 2.6) and the higher scenario (RCP 8.5). Use the figure to answer the following questions.
- Which regions will experience the greatest warming in both RCP scenarios?
- Focus on the temperature change for Florida.
- What is the approximate temperature change for the low RCP 2.6 emissions scenario?
- What is the approximate temperature change for the high RCP 8.5 emissions scenario?
- What is the difference in temperature change between the lower and higher scenarios?
- Focus on the temperature change for Greenland.
- What is the approximate temperature change for the low RCP 2.6 emissions scenario?
- What is the approximate temperature change for the high RCP 8.5 emissions scenario?
- What is the difference in temperature change between the lower and higher scenarios?
- How much does the temperature in North America vary geographically (southern versus northern regions) for the:
- Low 2.6 emissions scenario?
- High 8.5 emissions scenario?

