Exploration 2
A Comparison of Northern and Southern Hemisphere Temperature Anomalies
In the last exploration, you learned about land and ocean temperature anomaly trends. In this exploration, you will analyze the temperature anomaly trends for the Northern and Southern Hemispheres.***To print this exploration and record your responses, download this PDF document .***
Once you have finished Exploration 2, read the Scientists' Explanation for A Comparison of Northern and Southern Hemisphere Temperature Anomlaies.
Temperature Anomaly Data for 1880-2010: Northern and Southern Hemisphere Temperatures
Use the interactive, time series graphing tool above to answer the following questions.
- Make a few hypotheses before you begin to compare the 130-year Northern and Southern Hemisphere temperature anomalies.
- Do you think Northern and Southern Hemisphere temperature anomalies will both show a warming trend?
_____ Yes _____ No - Do you think that the more recent decades will show an increased rate of warming for both Northern and Southern Hemisphere?
_____ Yes _____ No - Which do you think will have a greater range between high and low temperature anomalies?
_____ Northern Hemisphere _____ Southern Hemisphere - Which do you think has more variable temperature anomalies over time?
____ Northern Hemisphere _____ Southern Hemisphere
- Do you think Northern and Southern Hemisphere temperature anomalies will both show a warming trend?
- Uncheck the box next to Global and check the Northern and Southern Hemisphere boxes to display the temperature anomaly data for 1880-2010. Describe the general temperature anomaly trends over this time period.
- To analyze the Northern Hemisphere temperature anomaly variation, click on the Southern Hemisphere box below the graph to uncheck it. Then click on the Northern Hemisphere box. You should see the Northern Hemisphere temperature anomaly data.
- Describe the general temperature anomaly trend over this time period.
- What is the lowest temperature anomaly recorded during that time period? What is the highest? What is the range of temperature anomalies (lowest to highest)?
- To analyze the Southern Hemisphere temperature, click on the Northern Hemisphere box below the graph to uncheck it. Click on the Southern Hemisphere box. You should see the Southern Hemisphere temperature anomaly data.
- Describe the general temperature anomaly trend over this time period.
- What is the lowest temperature anomaly recorded during that time period? What is the highest? What is the range of temperature anomalies (lowest to highest)?
- Now zoom into the graph for the last 25 years (1985-2010).
- Describe the change in the Northern and Southern Hemispheres temperature anomalies.
- Which hemisphere is showing more of a warming trend?
- Which hemisphere shows more variation in temperature anomalies?
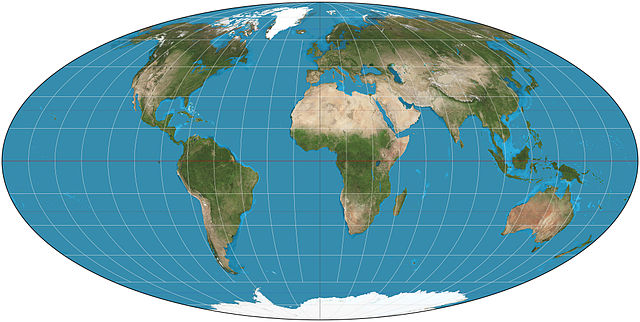
- You previously learned that land warms more quickly than the ocean. Use the map of the Earth below and discuss how this relates to your answer in question 5.
Download Data