Scientists' Explanation for Exploration 3
Proxy Data and Temperature Before the Industrial Revolution
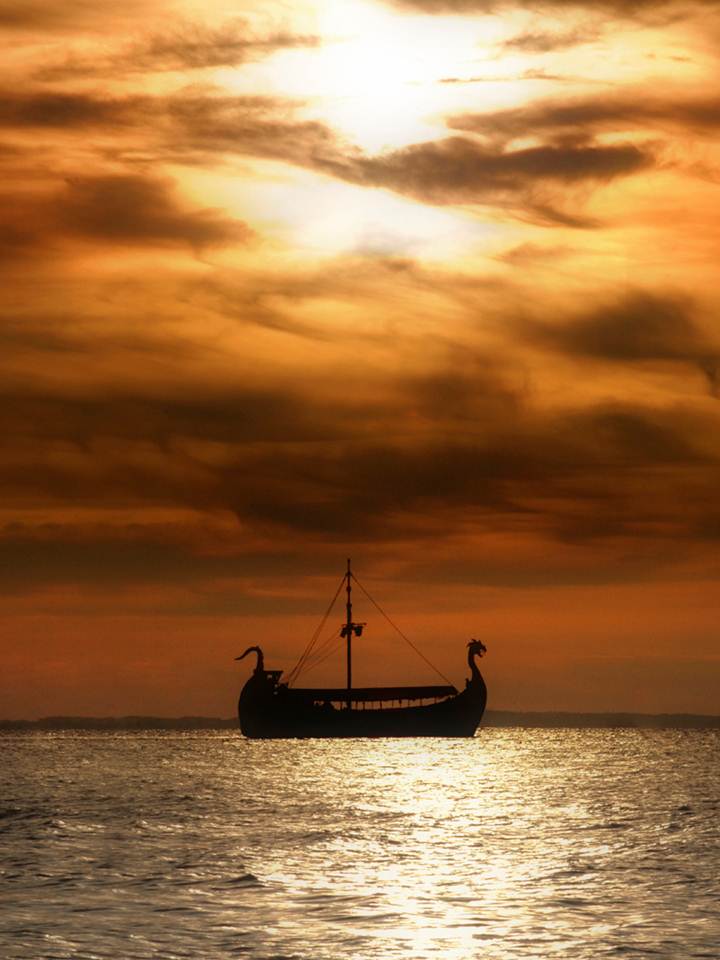
Image Credit: Microsoft Clip Art
During the Medieval Warm Period, the Vikings traveled from Norway, Sweden, Finland, and Denmark to settle Iceland and Greenland. The warmer climate made it possible for the Vikings to migrate across the North Atlantic in search for more land and resources. However, the colder climate during the Little Ice Age, caused settlements in Greenland to basically vanish and those in Iceland to struggle to survive from starvation and a declining fishing industry.
The evidence from climate proxy data indicates that Europe experienced a 300-year period of relative warmth from about 950 to 1250 (known as the Medieval Warm Period). During the Medieval Warm Period, Western Europe had relatively mild winters and warm dry summers. Raymond Bradley, a paleoclimatologist at University of Massachusetts, determined that the highest Medieval mean temperatures were approximately the same as the mean temperatures between 1901 to 1970.
Europe then experienced a period of record cold between 1300 and 1850 (known as the Little Age Ice). During the Little Ice Age, the mean annual temperature was about 0.5°C (0.9°F) lower than in 1900. This multi-century period was characterized by variable climate, causing food shortages, economic, political, and social conflict in Europe.
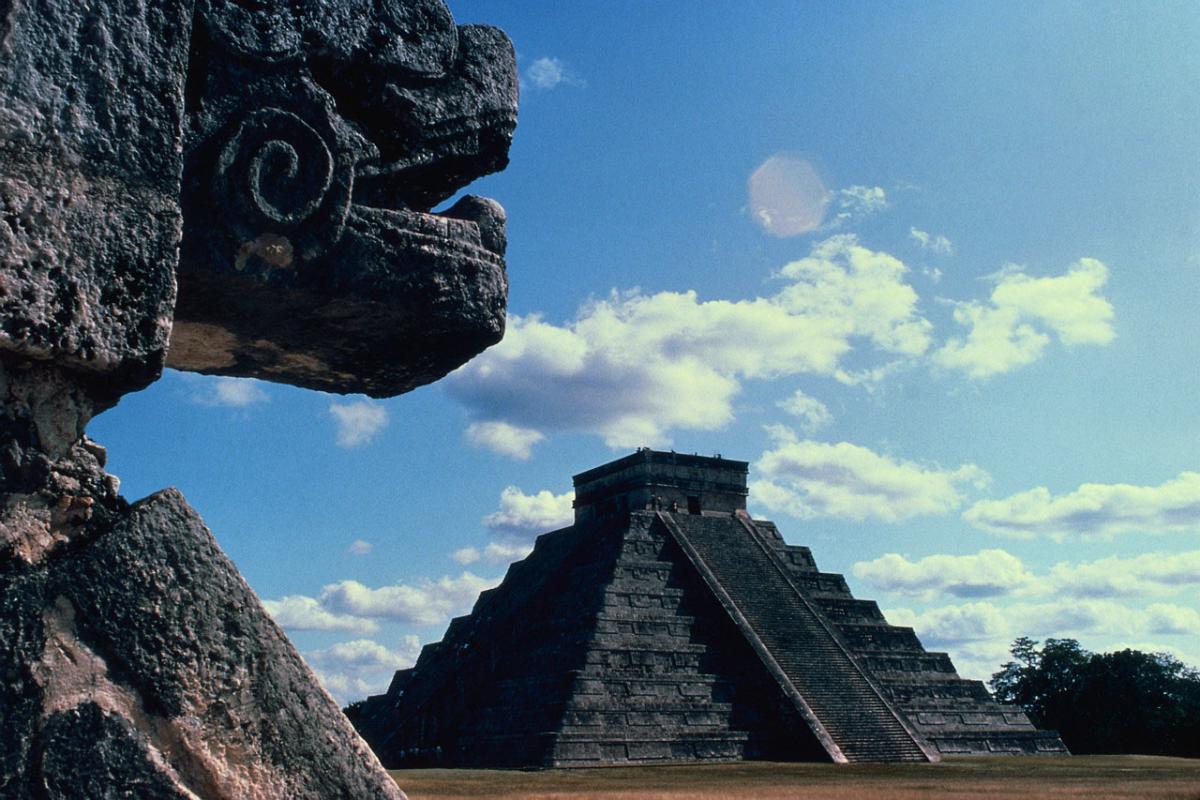
Image Credit: Microsoft Clip Art
Climate and Civilizations
While the Europeans may have been experiencing widespread warmth, the Mayans, whose empire extended from what is today Mexico to Central America, may suffered from severe drought. This is hypothesized to have lead to collapse of the Mayan civilization about 950 years ago.
Although there was some variation in temperature (warming from 950-1250 and cooling from 1300-1850), the time between 2000 years ago until the late 1800’s was a relatively stable period of time. But as you observed in the data, sometime around the middle to later 20th century, temperatures increased sharply. This graph of rapid temperature increase in the later 20th century is often referred to as the “Hockey Stick” because of the resemblance to a hockey stick.
Watch this NSF video of Dr. Mann explaining his data and why our current warming trend is unusual.